Three projects where messy, incomplete field data became services that operators and growers use every day, each told through the problems it hit and how they were solved, followed by four key papers.
Anomaly detection · water supply·Municipal waterworks · at the AI startup
Finding leaks in flow data
A detection model and dashboard that flags suspected leak blocks from water-network flow data in real time. It started by redefining field records, which never logged when a leak began, into something a model could learn from.
PythonXGBoostEMAFeature engineeringREST API
90%
Accuracy+19%p
0.63
F1 score+0.32
20+
engineered features
water-leak-detection / dashboard
Live flow monitoring · AI detection2 suspected leaks
FlowEMA baselineSuspected leak
Time
Block
Status
Conf.
03:20
A-12
Leak
92%
04:15
B-05
Leak
88%
05:30
C-09
Watch
65%
Redrawn example of the service screen
EMA baseline on the chart
A moving baseline drawn over the flow so field staff can judge anomalies at a glance
AI alert list
Suspected leak blocks arrive as live alerts, replacing manual watching
REST API
Results served over an API and wired into the existing control system
Delivered as a service the operators could use the same day, not as a report
Problem 1Defining a leak
Turning vague field records into training data
Problem
No record of when leaks began
Only "repair finished" was logged, never the start of the leak
Labelling by repair date would teach the model that a leak in progress is normal
Solution
Back-traced labels
Windows
The day before a repair is abnormal; a week after the repair onward is normal
Context
Season, weekday and pressure joined in to keep only real leak patterns
Leak start unknownAbnormalExcludedNormal
?Repaired+1 week
Day before repair → abnormal From a week after → normal
Missing data became an analysis problem: incomplete records redefined as a learnable dataset
Problem 2The alarm line
From a hand-drawn straight line to a data-driven curve
Problem
A fixed straight threshold
The minimum-night-flow (MNF) limit was a straight line set from experience
It ignored seasons and changing use, so normal flow was often flagged as a leak
Solution
A moving EMA baseline
EMA
An exponential moving average that weights recent data and follows the trend
Seasonality
A baseline that follows the flow instead of a fixed line cut false alarms sharply
A rule of thumb replaced by a statistical baseline, so alarms could be trusted
Problem 3Model upgrade
A classifier that sees non-linear interactions
Problem
Limits of a single baseline
Leaks show up through non-linear mixes of weekday, season, hour and pressure, not flow alone
A one-variable threshold misses small leaks and shifting patterns
Cut-off tuned on the precision-recall trade-off to keep false alarms down
Accuracy
Before71%
After90%
F1 score
Before0.31
After0.63
Accuracy 71% → 90%, F1 0.31 → 0.63
02
Forecasting · smart farming·2025 · smart-farm company
Forecasting the greenhouse climate
A model inside the greenhouse management software that forecasts the next 24 hours of temperature and climate, then simulates when vents and heaters should run. The multivariate mix of climate, control and weather-forecast data was redesigned from the input structure up.
Climate forecast · simulation (temperature)AI control ON
MeasuredAI forecast
Time
Forecast
Vent
Heater
14:00
24.5℃
Open 30%
OFF
15:00
23.8℃
Open 10%
OFF
16:00
21.2℃
Closed
ON (stage 1)
Redrawn example of the service screen
Inside the farm software
The model runs inside the existing control system and shows the next 24 hours live
Control simulation
Simulated vent and heater timing for proactive crop management
Production-grade accuracy
MAE 1.1 and R² 92%, steady enough to guide control through season changes
Finished as a running service that helps growers decide
Problem 1Many inputs
Past the limits of RNNs with a transformer and stream embeddings
Problem
RNN and LSTM hit a ceiling
RNN-family models degrade as inputs grow in number and complexity
Climate, control and forecast variables were mixed with no sense of what each meant
Solution
A new architecture
PatchTST
Patches of the series capture long context and cut compute
Multi-stream embedding
Climate, control and weather groups enter as separate streams, keeping their character while learning how they interact
ClimateControl settingsWeather forecast
→Multi-stream embedding→PatchTST→Next 24 hours
Learning climate-control interactions by design raised forecast accuracy
Problem 2Control data
Reshaping tangled control settings for learning
Problem
Semi-structured data and too many columns
Settings per device and per time slot were tangled and awkward as model input
Flattening them exploded the feature count, slowing training and inviting overfitting
Solution
Domain-driven compression
Period mapping
Settings re-assigned to the 4–6 periods the greenhouse controller actually runs
One-third the features
Merging and restructuring kept the signal and cut dimensions sharply
Flattened per device and slot
24
→
Mapped to 4–6 control periods
8 (1/3)
Domain knowledge built into the data structure itself
Problem 3Robustness
A forecast that holds up through seasons and new settings
Problem
Errors spike when conditions shift
A new season or new greenhouse settings shifted the data distribution and accuracy collapsed
Adapting meant collecting lots of new data and retraining every time
Solution
Trend decomposition
Trend
A moving average over the input window serves as the baseline and absorbs sudden shifts
Residuals
Predicting only the deviation instead of the full value makes learning easier
Autoformer
Its idea, applied here, improved accuracy by 80–100% under changing conditions
R²
Stable92%
Changing84%
MAE (℃)lower is better
Stable1.1
Changing1.7
Under changing conditions: R² 84%, MAE 1.7, still within range
03
LLM agents · smart farming·2025 · smart-farm company
AI consulting reports written by LLM agents
A service that moves a consultant’s diagnosis into an LLM-agent workflow and writes each farm a weekly report with charts, tables and concrete actions. It ships to real strawberry growers as PDF and web links and keeps improving on their feedback.
LangGraphLLM AgentPythonAuto charts & tables
Weekly
report per farm
24/7
always-on advice
PDF · Web
shipped to growers
smart-farm-consulting / report.pdf
Weekly strawberry growth reportMarch, week 2
Weekly mean temperature
Mean temperature18.5℃ OK
Mean humidity82.0% Too humid
Action plan
Night humidity stays above 90% for long stretches, so grey-mould risk is high.
– Raise the night heating set point by 1℃ – Add 30 minutes of ventilation before sunrise
Redrawn example of the service screen
Charts and tables
Not a text reply: a full report with time-series charts and summary tables, fully automated
Actionable advice
Concrete steps such as "raise night heating by 1℃" or "add a ventilation slot"
In growers’ hands
Sent weekly to strawberry farms as PDF and web links, refined with their feedback
A service that extends the expert, not one that replaces them
Problem 1Access to experts
Scaling scarce expertise with AI
Problem
Not enough consultants
Smart farms are multiplying faster than consultants, and small farms can’t afford them
Advice only came with a visit, so nobody watched the data in between
Solution
Extending the expert
Logic as a workflow
A working consultant’s diagnosis process rebuilt as a LangGraph agent workflow
Always on
Advice for every farm, any time, anywhere
Climate and growth dataConsultant’s diagnosis
→LangGraph agents→Weekly report
AI carries the expert’s know-how further instead of replacing them
Problem 2Flexible reports
Reports that re-plan themselves instead of filling a template
Problem
A rigid template
Every farm got the same template, with no room for exceptions or surprises
Numbers were listed without explaining why things happened
Solution
Dynamic generation with agents
Dynamic outline
The outline and content are rebuilt for each farm’s data and situation
Mixed media
The agent decides which chart or table explains each point and places it
Fixed template
Same for every farm
→
Farm A
Humidity alert first
Farm B
Growth table
A way of reporting that can follow qualitative criteria and requests
Real sampleOne page of an agent-written weekly report
Inside temperature, in detail
Daily charts and statistics
Daytime mean 18.27–20.36℃, daytime high 25.97–27.48℃
Night mean 9.94–12.54℃, with several nights down to 7.85–8.91℃
Mean up 1.27℃ on the previous week
Range advice
For late harvest, keep 16–24℃ by day and 10–14℃ by night
Repeated 8℃ nights slow fruit growth and colouring: insulate first, heat minimally
Related variables
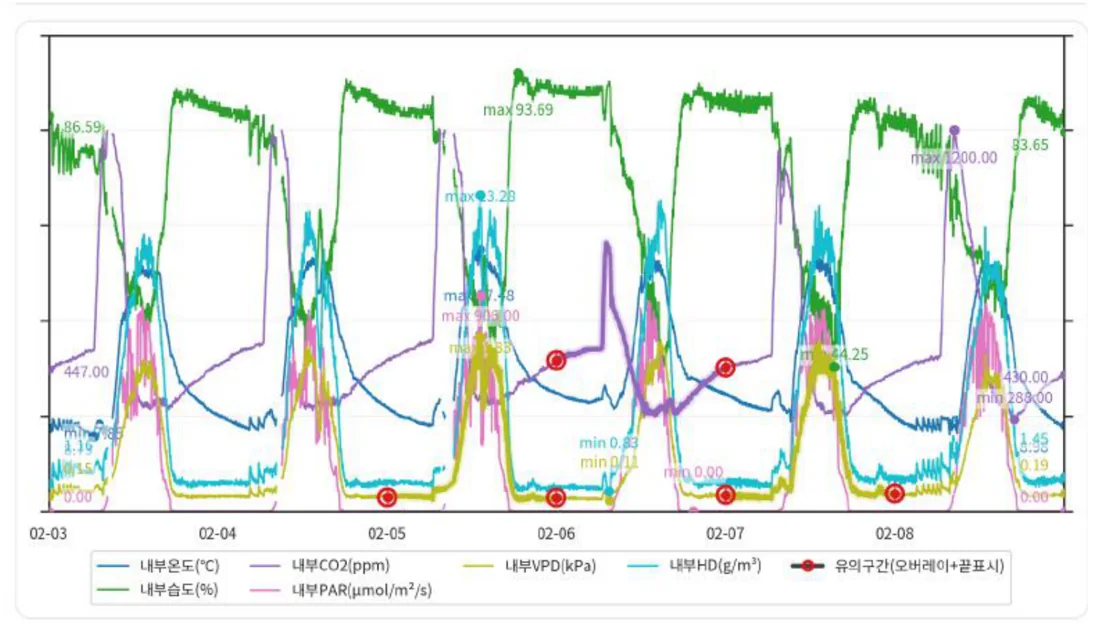
By day RH fell to 44% as PAR rose, pushing VPD up to 1.8 kPa
At night RH stayed at 80–93% with VPD 0.11–0.28, so only condensation needs watching
R
Papers·2020–2024
Key research
Four papers that started from field problems. Sea temperature, dental 3D scans, construction contracts and hateful comments: different data, the same work of filling the gaps in real-world data.
4
key papers
3
KCI journals
1
industry collaboration
2024.11Conference
Sea temperature forecasts that use weather forecasts
Multi-group time-series AI for ocean forecasting: sea-temperature prediction combining weather forecasts and deep learning
R² 0.992MAE 0.383
Problem
Warming seas bring red tides and fishery losses, yet existing models overfit one area and need 1–2 years of data for a new one
Data
Ocean time series from several Korean sea areas, plus weather forecasts
Method
A multi-group GRU encoder-decoder that learns all areas together, with future weather forecasts fed to the decoder
Result
Best of the compared models at R² 0.9919 and MAE 0.3832